In this section, we show you how to analyse your data using a Wilcoxon signed-rank test in Minitab when the three assumptions in the previous section, Assumptions, have not been violated. Therefore, the three steps required to run a Wilcoxon signed-rank test in Minitab are shown below:
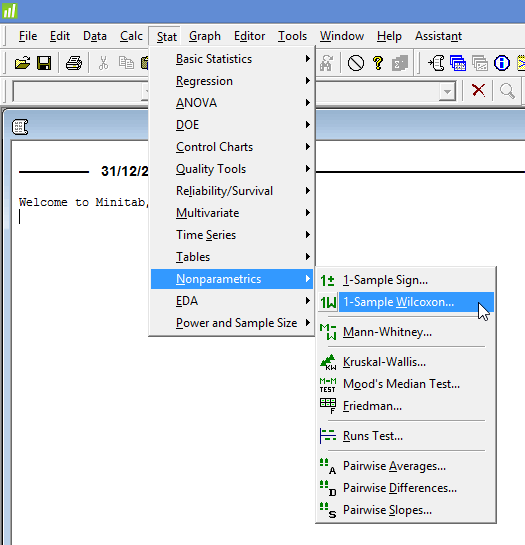
- Click Stat > Nonparametrics > 1-Sample Wilcoxon... on the top menu, as shown below:
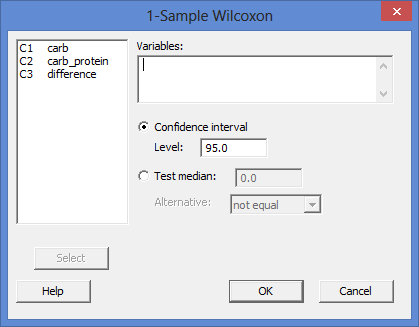
You will be presented with the following 1-Sample Wilcoxon dialogue box: Published with written permission from Minitab Inc.
 Published with written permission from Minitab Inc.
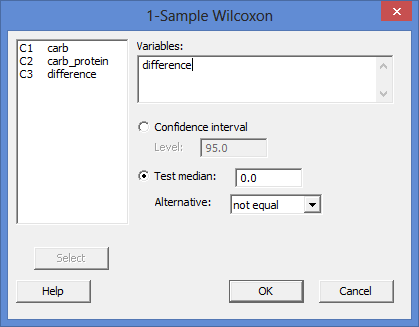
 - Enter the difference score, difference, into the Variables: box, and then select the Test median: option. Leave the value at 0.0 in the Test median: box and keep the alternative hypothesis set at not equal in the Alternative: box. You will end up with the dialogue box shown below:
 Published with written permission from Minitab Inc.Note 1: To transfer the difference score, difference, you first need to click inside the Variables: box for your two related groups to appear in the main left-hand box (e.g., C1 carb and C2 carb_protein), as well as the difference score (e.g., C3 difference). This will activate the
 button (it is usually faded:
  ). To transfer the difference score, difference, into the Variables: box, you can now either select C3 difference in the main left-hand box and press the
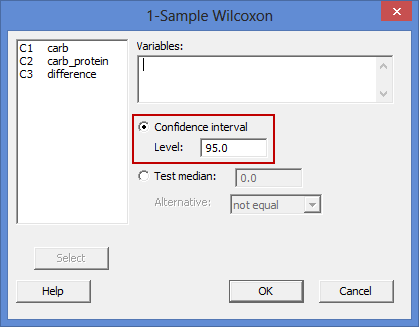
  button or simply double-click on C3 difference.Note 2: By default, Minitab uses 95% confidence intervals, which equates to declaring statistical significance at the p < .05 level. If you want to change the value of the confidence interval, select the Confidence interval option and enter the new value into the Level: box (e.g., a value of 99.0 would equate to declaring statistical significance at the p < .01 level), highlighted in red below:
Minitabtop ^
Output of the Wilcoxon signed-rank test in Minitab
The Minitab output for the Wilcoxon signed-rank test is shown below:
Note: We present the output from the Wilcoxon signed-rank test above. However, since you should have tested your data for the assumptions we explained earlier in the Assumptions section, you will also need to interpret the Minitab output that was produced when you tested for them. This includes the histogram you need to determine whether the distribution of the differences between your two related groups are symmetrical in shape. Also, remember that if your data failed this assumption, the output that you get from the Wilcoxon signed-rank test procedure (i.e., the output we discuss above) might no longer be valid and you will have to take steps to deal with such violations (e.g., transforming your data using Minitab) or use a different statistical test instead.


No comments:
Post a Comment